BP released its Statistical Review of World Energy this week, and the 67th edition of the highly-anticipated annual report not only shows that oil and natural gas consumption increased significantly in 2017 — but that the United States is most ideally positioned to meet likely strong demand going forward, thanks to the ongoing shale revolution.
The report finds that global energy consumption grew 2.2 percent in 2017, the highest annual increase since 2013. And as the following chart from the report illustrates, oil and natural gas consumption grew significantly in 2017 as well, making up almost 60 percent of the global energy consumption mix.

‘Bumper Year’ for Natural Gas
The report finds that global natural gas demand increased three percent in 2017, making it “the fastest growing source of energy last year.”

Coupled with a four percent increase in global natural gas production, BP chief economist Spencer Dale notes in a video accompanying the report that:
“2017 was a bumper year for natural gas. Both global gas consumption and production grew at their fastest rates since the financial crisis of 2008 and 2009.”
“Natural gas and renewables together accounted for around 60 percent of the growth of energy demand. So that’s 60 percent coming from cleaner energy in the form of renewables and natural gas.”
The report notes that China was “perhaps the key single driver” of increased global natural gas demand — a trend that isn’t likely to change going forward, according to the report:
“China gas consumption grew by around 15 percent , accounting for a third of the global increase in gas demand. This was guided by environmental policies driven by both industry and households to shift away from coal into clean fuels, particularly into natural gas.”
This is one reason why the outlook for the U.S. natural gas industry remains bright despite the fact that the report notes domestic natural gas consumption decreased in 2017. Thanks to increased demand in countries such as China, coupled with surging domestic production due to fracking, the report notes that the U.S. became a net natural gas exporter in 2017 for the first time since 1957. This is due in large part to the fact that liquefied natural gas exports increased 304 percent from 2016 to 2017.
In the span of just three years, the U.S. has gone from exporting virtually no LNG to becoming the fourth-largest LNG exporter in the world in 2017 (17.4 billion cubic meters), according to the report’s data.
‘Peak Oil Demand’ Myth Debunked (Again)
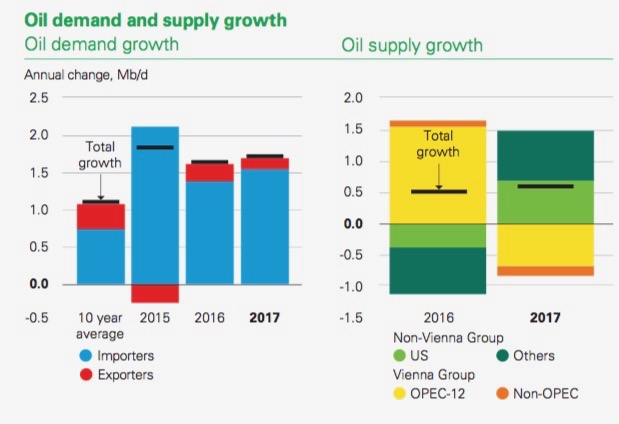
The report completely debunks the notion of peak oil demand, noting that global oil consumption growth averaged 1.8 percent — or 1.7 million barrels per day (b/d) —above the 10-year average growth rate of 1.2 percent for the third consecutive year.

Dale noted:
“To put the recent strength of oil demand in context, average growth over the past five years is at its highest level since the height of the commodity super-cycle in 2006-07. This was despite all the talk of peak oil demand, increasing car efficiency, growth of electrical vehicles.”
This is encouraging news for U.S. oil producers, who increased production by 690,000 bpd in 2017, boosting production to a record 13.1 Mb/d. Leading the world in both volumetric and total percentage growth at 5.6 percent, U.S. oil production growth (including crude and NGLs) was spearheaded by tight oil, according to Dale:
“Since the end of 2016 through the spring of this year, U.S. tight oil has increased by over 1.5 million barrels of oil . Was U.S. tight oil enough to stop the overall OPEC cuts from working? No, they did work. But did U.S. tight oil respond? Absolutely. U.S. tight oil is alive and kicking.”
Thanks to surging tight oil production, the report notes that net U.S. oil exports dropped to 4.5 Mb/d in 2017, the lowest level since 1985. And although oil remains the dominant fuel in the U.S. energy mix — accounting for 40.9 percent of total energy use — imported oil had its smallest share of total U.S. energy consumption on record, according to the report.
United States Continues to Lead World in Carbon Reductions
As impressive as the U.S. oil and gas production and demand for petroleum detailed in this report are, the most remarkable U.S.-specific factoid from the report may be the fact that the United States continues to lead the world in carbon dioxide reductions despite the economic growth that has been spearheaded by the ongoing shale revolution.
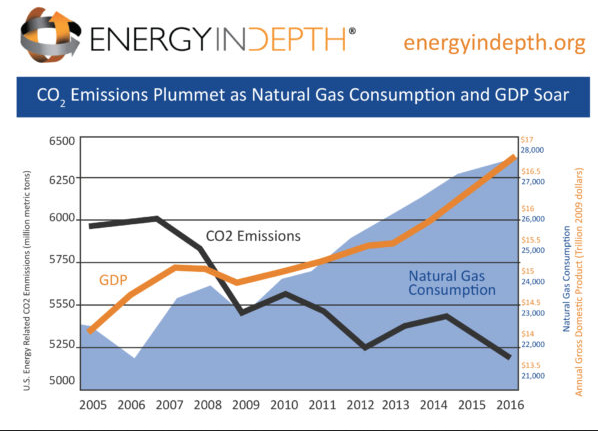
The report notes that U.S. carbon emissions declined 0.5 percent from 2016 to 2017 even though energy consumption increased 0.6 percent. These declines came at the same time that global carbon emissions increased 1.5 percent, illustrating the fact that the United States continues to lead the world on the greenhouse gas reduction front, thanks largely to increased natural gas use made possible by affordable and abundant supply made possible by fracking. From the report:
“ Declines were led by the US (-0.5%). This is the ninth time in this century that the US has had the largest decline in emissions in the world. This also was the third consecutive year that emissions in the US declined…”
“ Emissions reached their lowest levels since 1992 and were 13.5% below the peak seen in 2007. … Carbon emissions from energy use from the US are the lowest since 1992…”
This once unthinkable trend of declining emissions coupled with economic growth has become the new normal for the United States. The BP report notes that U.S. energy intensity — the amount of energy required per unit of GDP — fell by 1.6 percent in 2017, which is in line with the 10-year average illustrated in the following EID graphic.

The BP findings echo a recent Carnegie Mellon University report that finds that the United States has reduced its carbon intensity 30 percent since 2001, thanks largely to natural gas.
All told, the various energy figures in BP’s latest statistical review reveal global demand for oil and natural gas is increasing rather than waning. And the United States is helping meet that rising demand while reducing emissions — thanks to fracking.
No comments:
Post a Comment